2017年5月21日星期日

Global methanol industrial distribution in 2016 China still takes the leads by ECPRAMS.NET

Global methanol industrial distribution in 2016
China still takes the leads


1. Introduction of Capacity and Output of International Methanol Industry


Fig. 2010-2016 Global Capacity and Production Data For Methanol

From the above figure, we can see a rapid growth of global supply and demand for methanol. In 2010, the global methanol production capacity reached 64 m tons, while in 2011 of 79.5 m tons, with an average annual increasing rate of more than 10 m tons, yet the demand growths were lagging far behind the capacity growth. The average operating rate of the methanol unit was maintained at around 60%-65% from 2010 to 2011 due to overcapacity. Since 2012, the situation of global methanol overcapacity has been effectively alleviated, driven by the rapid development of methanol to gasoline, methanol to dimethyl ether and methanol to olefins, especially China's massive methanol olefins projects were put into operation in 2015, which pulled global demand for methanol to 85 m tons and the average operating rate of the methanol plant recovered to around 80%. In 2016, the global capacity of methanol will reach 135 m tons, and the output will be around 100 m tons.

2. Analysis For the Supply Direction of Methanol in the Major Regions around the World
Fig. Global Supply Direction Map of Major Methanol Regions around the World in 2016

In 2016, new trade flow directions to Asia (mainly China) were from Americas, including the United States, Trinidad, Venezuela and Tobago. The reduced trade flow directions were from Middle East to America, Europe and Southeast Asia, etc. For international methanol trade changes over the next 4-5 years, we believe that the new supply side is mainly in the United States and Iran, while the demand side is mainly in china, so in the future U.S. supply to China will gradually increase, while the South America will also choose to trade arbitrage in China under the crowding out of its own increased capacity, the Iranian region will also increase its trade with China and may return to the European and American markets for a share of the competition.

3. Analysis For Global Downstream Demand Structure of Methanol

Fig. 2013 Global Methanol Downstream Demand Allocation Ratio

Fig. 2014 Global Methanol Downstream Demand Allocation Ratio

Fig. 2015 Global Methanol Downstream Demand Allocation Ratio

Fig. 2016 Global Methanol Downstream Demand Allocation Ratio

As can be seen from the 2013-2016 global demand-consumption allocation ratio, the world's fastest growing downstream items were coal / methanol to olefins in recent years, which were mainly in China. At present, the capacity of coal/methanol to olefins in China is around 12 m tons, the estimated consumption of methanol is over 30 m tons, accounting for about 41% of the total global consumption. However, the proportions of formaldehyde, dimethyl ether, acetic acid and MTBE in the traditional demand have declined.

Fig. Proportion Ratio Chart for Global Methanol Capacity in 2016

According to data from ECPRAMS,  the global methanol capacity reached 135 m tons in 2016. Among them, Asia's production capacity was up to 98.22 m tons, accounting for 72.5% of global total production capacity and ranking first. The second was South America, with capacity of 14.4 m tons, accounting for 10.63%. Europe has a capacity of 8.01 m tons, accounting for 5.91%, ranking third. In the Asian capacity distribution, China's methanol production capacity was 77.35 m tons in 2016, accounting for 78.75% of the total capacity in Asia, and accounting for 57.1% of global methanol production. China still holds the leading position in the global methanol industry.
4、结论
4. Conclusion

In the international methanol market, the key player is Asia; while in Asian market, the key player is China. By definition, China's methanol production and production capacity combination will have a greater impact on the inland market, while the Renminbi in inland market will continue to be closely linked to the US dollar. China's proportion in global market will rise to around 78% to continue the first position.

......

ECPRAMS release energy and chemical, rubber and plastics, steel, metals, agricultural commodity market data on regular basis, daily/weekly/monthly/annually.
This is a sample report. More data could be available via subscription.
Please send your inquiry email to: service@ecprams.net
or call at +86 18606382728  
skype: oilchem-lz  
Wechat: hanamiliu
Whatsapp: +86 18606382728

website: http://www.ecprams.net


China's tyre export surging in Q1 2017

According to ECPRAMS data, from January to March, total exports of HS CODE 40112000(new type of pneumatic rubber tire used in passenger vehicle or freight vehicle) were 7.2525 million tons, up by 1.8% Y-O-Y. The top ten tire enterprises’ total exports of HS code 40112000 item is 307,310 tons in all, accounting for about 42.37% of total exports. In view of individual enterprise, the top ten enterprises exports were all more than 20,000 tons, among which Zcrubber and Triangle exported 47,610 tons and 41460 tons respectively.


Even though Zcrubber and Triangle among top ten enterprises exported more than 40,000 tons, the exports increase was moderate compared with the same period last year. It could be observed, that the deployment of these enterprises is in proper arrangement in market abroad, with products exported to more than 150 countries. In all exporting countries, the US market is a key target country for export, 8600 tons of tires were exported to the United States in Q1 2017, which accounted for 20% of the total export volume of the plant. The triangle copmany also exported to nearly 150 countries, including Mexico which is the largest target country, exported 3100 tons of tires in total, accounting for about 10% of the total exports of the plant. The volume exporting to the United States took only 3.6%.

The increase of Prinx Chengshan was up to 55.32%, which top the growth among the top ten enterprises. From all its target countries, we could observe its key oversea market is America, with totally 8650 tons of tires export in Q1, accounting for about 42.2% of the total export volume of the plant.
 ......

ECPRAMS release energy and chemical, rubber and plastics, steel, metals, agricultural commodity market data on regular basis, daily/weekly/monthly/annually.
This is a sample report. More data could be available via subscription.
Please send your inquiry email to: service@ecprams.net
or call at +86 18606382728
skype: oilchem-lz
Wechat: hanamiliu
Whatsapp: +86 18606382728
website: http://www.ecprams.net

2017年5月17日星期三

MMA Prices Not Affected By Fluctuations And Remain Stable


In H2 of April, MMA market entered into a period of rest which may last for a month after severe turbulence. The prices in all the primary markets remained stable for two consecutive months, while in Secondary Market of East China even fell from top value ending the mad state spawned by the export market from March to April and returned back to appropriate prices which in reasonable difference level with the primary markets. Market sentiments from all parties also gradually passed into a sage mode, which holds relatively steady opinions towards future trend.

According to ECPRAMS’s tracking, intensive inquiries were covered by several major exporters towards Chinese MMA traders as main purchasing objects in last two working days of second week in May, the initial negotiation price was at RMB17,800/Mt.  At the same time, 200kt/a MMA unit in Lucite at Britain has announced force majeure, MMA unit in Evonik at America and Europe also has also entered the case of regular maintenance, so the secondary markets were driven a little. In addition, the relevant aspects have also tasted the sweetness due to remaining booming market sense, so the local market was rapidly warming.
As a result, MMA suppliers immediately adjust the price above RMB18,000/Mt. They still tend to stable prices for contract users with the supply principle of insured quantity.

According to ECPRAMS’s statistics, Chinese MMA production capacity will scale up to 1.2 million tons by 2020. With the breaking and upgrading of technical barriers, MMA overcapacity will be only a matter of time in China. Meanwhile, as the service life of some older MMA devices in Europe and the United States continue to increase, their risks are increasing simultaneously. In the long run, China's increase in MMA exports will be inevitable.
......

ECPRAMS release energy and chemical, rubber and plastics, steel, metals, agricultural commodity market data on regular basis, daily/weekly/monthly/annually.
This is a sample report. More data could be available via subscription.
Please send your inquiry email to: service@ecprams.net
or call at +86 18606382728 
skype: oilchem-lz 
Wechat: hanamiliu
Whatsapp: +86 18606382728
website: http://www.ecprams.net


2017年5月16日星期二

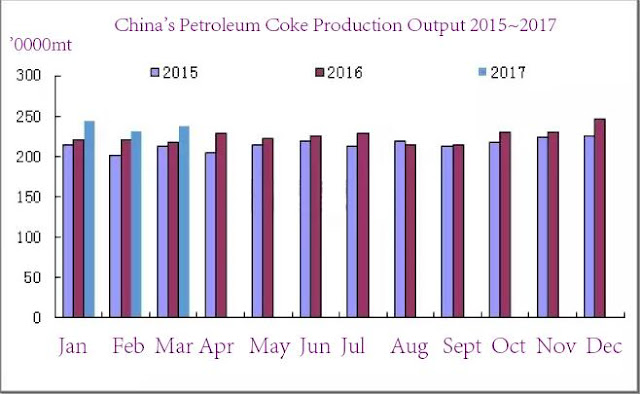
China's petroluem coke market movement in the Q1 of 2017


Petroleum coke output in the first quarter of 2017 was 7.13 million metric tonnes, up by 0.9% M-O-M and 8.53% Y-O-Y. From perspective of component data,  Chinese production have increased from January to March, among which the the largest increase occurred in January, up by 8.53% Y-O-Y.

Judging from the specific group component data, local refineries increased considerably while state-owned plants increased moderately. In the first quarter, the average operating rate of coking units in Shandong Province was 62.36%, up by 6.82% Y-O-Y. As a consequence, the increase of operating rate will directly increase the output of petroleum coke.

In the first quarter of 2017, total imports of petroleum coke was 136.27/mt, up by 50.62% Y-O-Y. Viewed from monthly data, Petroleum coke imports remained at a reasonable level in January and February, but  imports suddenly increased in March, up by 82.96% Y-O-Y.


From the view of specific customs data,  imports from the United States increased significantly, and the Nanjing Customs topped the volume, the main reason is that imported coke traders added orders in fourth quarter of 2016 and first quarter of 2017 due to great demand in Chinese petroleum coke and coal market, while there were 2-3 months lag phase from USA to China, so petroleum coke imports has increased greatly in March. ECPRAMS predicted that petroleum coke imports will remain at such a high level in the next second quarter.


In the first quarter of 2017, petroleum coke exports were only 16.25/mt, down by 18.3% Y-O-Y. From perspective of  monthly data, the export volume was lowest in February due to continued hot sales in Chinese market.


......

ECPRAMS release energy and chemical, rubber and plastics, steel, metals, agricultural commodity market data on regular basis, daily/weekly/monthly/annually.
This is a sample report. More data could be available via subscription.
Please send your inquiry email to: service@ecprams.net
or call at +86 18606382728 
skype: oilchem-lz 
Wechat: hanamiliu
Whatsapp: +86 18606382728
website: http://www.ecprams.net

2017年5月15日星期一

China imported 618,300 metric tons of waste PE in Q1 2017

China imported 618,300 metric tons of waste PE in Q1 2017, slide by 4.18% from last quarter, and increase by 21.64% Y-o-Y. March had the biggest import volume......China has relatively larger demand for recycle PE from US and Germany, imported 75,200 metric tons and 71,100 metric tons respectively.Among the imported items, high pressure products take the most share up to 90%. China's domestic market demand more film from US, Germany an Japan, but Japan's film had higher price and no much supply......


ECPRAMS release energy and chemical, rubber and plastics, steel, metals, agricultural commodity market data on regular basis, daily/weekly/monthly/annually.
This is a sample report. More data could be available via subscription.
Please send your inquiry email to: service@ecprams.net
or call at +86 18606382728 
skype: oilchem-lz 
Wechat: hanamiliu
Whatsapp: +86 18606382728
website: http://www.ecprams.net


2017年5月11日星期四

Zhongtian Hechuang's second PE production line in operation

Zhongtian Hechuang Energy Co., Ltd., China’s largest coal-to-polyolefins processing project, has started up its second polyethylene production line in early May 2017, following its successful operation of the 300kt/year LLDPE facility and 350kt/year PP facility since October 2016. 

The newly started low density polyethylene (LDPE) plant is based on tubular process, and is currently running at 80% of the total capacity for LDPE LD605. 

Zhongtian Hechuang’s major production facilities 
Capacity (kt/year)FacilityProcess
1800coal-to-methanol 
1800methanol-to-olefins 
350PPloop process
350PPgas phase process
300LLDPEgas phase process
250LDPEtubular process
120LDPEautoclave processs
200OCC 

About Zhongtian Hechuang 
Zhongtian Hechuang Energy is a joint venture between Sinopec (38.75%), China Coal Group (38.75%), Shenergy Group Co., Ltd. (12.5%), and Inner Mongolia Manshi Coal Group (10%). 

Demonstration of coal deep processing 
Located in Ordos, Inner Mongolia autonomous region, the project is expected to go into full operation in July, producing 1.37 million tons of polyethylene and polypropylenes each year from 25 million tons of coal. 

"Our coal-to-chemicals project started production last October. It produces polyethylene and polypropylenes from coal, through a series of high-tech procedures, following the government's call for transforming resources in the ground," said Wang Jun, a spokesman from the joint venture which is owned by three State-owned companies and one private firm. 

Polyolefins are extracted from petroleum, but China is a country with rich coal reserves and a shortage of crude oil, he said. "The coal-to-polyolefins project has an advantage in costs so we do not need to only sell crude coal with low profits." 

The demonstration project is a good example of industrial upgrading, realizing coal deep processing from extensive production. 

There will be more of such demonstration projects in the near future in Ordos and Baotou, two cities in the west of the Inner Mongolia autonomous region, thanks to its success in industrial transformation and rich mineral resources.


ECPRAMS release energy and chemical, rubber and plastics, steel, metals, agricultural commodity market data on regular basis, daily/weekly/monthly/annually.
This is a sample report. More data could be available via subscription.
Please send your inquiry email to: service@ecprams.net
or call at +86 18606382728 
skype: oilchem-lz 
Wechat: hanamiliu
Whatsapp: +86 18606382728
website: http://www.ecprams.net


2017年5月8日星期一

Direct-spun PSF price to start a second round of fall

Direct-spun PSF price hiked for around half a month after the Spring Festival and then retreated all the way from mid-Feb till end-March, totaling a fall of 1,500yuan/mt. In early-mid April, it slightly rebounded while started dropping again in late-April. And in May, such a decline sped up. 

Tumbling commodity market due to tightened liquidity was credited for the first round of fall, which dampened previously positive market sentiment for sustained hike. And though the sentiment somewhat recovered in April, not strong polyester feedstock and gradually weakening demand still shed cloud on the market. Thus the sentiment turned bearish again. 
In the first round of fall, direct-spun PSF cash flow showed very good on the whole as polyester feedstock cost declined more than direct-spun PSF and rigid demand also lent some support. Losses from high-standing inventory of finished goods though was quite great. As for this round of fall, bearish market sentiment and sluggish demand or high inventory were the main causes. Polyester feedstock performed range-bound, thus it sped up direct-pun PSF price fall while decreasing while slowing down the process while hiking. Some plants inventory spiked to around 15-25days after the International Labor Day. And as demand shows no sign of warming up, more plants moves to lower the price to boost sales, thus its cash flow drops from 600yuan/mt to 300-400yuan/mt. 
At present, traded price declines to 7,200-7,400yuan/mt, and market players anticipate it to further fall to around 7,000-7,200yuan/mt. Should this level is reached in mid-late May while no support from polyester feedstock and commodity market appears, downstream concentrated restock may be limited. 
Sustained price decrease, however, may benefit for demand expansion and future price rebound. On Apr 18, the Chinese government passed a bill to ban solid waste imports. Though when and how it will be carried out is uncertain, this would surely bring about much influence on recycled polyester fiber industry in the long run as domestic re-PET import dependency rate hit as high as 50%. Once the import is banned, shortened feedstock supply is expected to lead to hiking feedstock cost of recycled polyester industry, which is favorable for virgin PSF to grasp re-PSF market share. In the short term, amid low price spread of 900yuan/mt of virgin PSF and conventional close virgin PSF as well as anticipated supply shortage of re-PET on rainy days in June, virgin PSF demand is expected to recover. 


ECPRAMS release energy and chemical, rubber and plastics, steel, metals, agricultural commodity market data on regular basis, daily/weekly/monthly/annually.
This is a sample report. More data could be available via subscription.
Please send your inquiry email to: service@ecprams.net
or call at +86 18606382728 
skype: oilchem-lz 
Wechat: hanamiliu
Whatsapp: +86 18606382728
website: http://www.ecprams.net

China’s Fuel Ethanol Industry Expansion Accelerates?


China’s economy suffered the depression in the past several years, and officially fell into the so-called “new-normal” stage which meant the over 10% GDP in 2000s had gone. However, the supply-side reform in 2016 receives satisfactory results, and the economic driving force enhances in 2017. In particular, the corn industry reform in China successfully reduces the corn price to the lowest level in decades, and Beijing implements a serious of policies to deal with 30 million mt of overstock corn issue. For example, even risking a trade conflict with the U.S., Beijing still built the tariff barrier by raising the ethanol import tariff from 5% to 30% at the end of 2016.

2002–2025 China’s Fuel Ethanol Output Review and Forecast
Meanwhile, as regulated in the 13th Five-Year Plan, China’s government makes great efforts on the renewable energy development and emission reduction. As the official alternative energy for emission reduction, Beijing plans to double China’s fuel ethanol production by 2020, and maybe quintuple it by 2025.
The international crude oil has been bogged down into a stalemate of surplus for several years. Although the crude oil price survives from the bottom - USD 27/bbl in early-2015 and rises back to USD 50 level, but the expendable power for further climbing has been exhausted. USD 50 level is an awkward position for all participants in the energy industry, and the crude oil fluctuates violently, bringing unsolid future to the energy market.
As the direct beneficiary, China’s fuel ethanol industry enjoys the great profit in 2017, and their operating rate skyrockets to over 90%, twice from that in 2016. Meanwhile, a serious of new projects are put into operation, construction or planning. As reported, SDIC Guangdong Bioenergy (150kt/a) and Shandong Fuen Biochemical (120kt/a) plan to enter the commercial production within 2017, and many other projects also accelerate the progress, such as Jiangsu Lianhai Biotechnology (200kt/a) and Kellin Chemicals (Zhangjiagang) (100kt/a).
Many new projects are also planned on the way. Inner Mongolia Shiqi Group’s 300kt/a fuel ethanol project initiated on Feb 15, 2017. It was planned to start the construction in June 2017, and put into use before the end of 2018. SDIC set up a project in Liaoning Tieling for a new 300kt/a corn-based fuel ethanol production, and the project was estimated to initiate within 2017.
China’s fuel ethanol industry developed very slowly in the past 15 years from the birth. As of the end of 2016, China’s fuel ethanol capacity was only 2,580kt/a, and the annual output was only 2,060kt/a. However, the blowout of the industry is coming. According to the statistics from SCI, the under-construction and proposed capacity is 3,140kt/a, and the target of 5,000kt/a fuel ethanol annual output in the 13th Five-Year Plan is likely to be accomplished within 2020, theoretically.
However, turbulence exists. The carbon emission efficiency issue between the fossil and renewable energy, the food safety issue, the competition from the low-priced refined oil, the diplomatic tension on the imports, etc., all those issues and problems continue to faze the fuel ethanol industry in China and the worldwide. The environmental protection supervision may help, but China’s fuel ethanol enterprises may also face the capital deficit problem. Henan Tianguan Group had ambitious plans on expansion, however, they failed because of the capital chain break.
In conclusion, China’s fuel ethanol industry has a promised future, or more precisely, quadrupling in ten years, and becomes the bellwether of China’s renewable and clean energy industry. However, there is still a long and thorny way to go through all the challenges from agricultural structure reform, geopolitical conflicts, competitive power in the global market, energy generation upgrade in the national economy, etc. In a short term like in one to two years, China’s fuel ethanol output will remain largely stable, because all those mentioned projects need time to be built. The fuel ethanol supply is likely to be short in China, and the China’s fuel ethanol import window may reopen.

ECPRAMS release energy and chemical, rubber and plastics, steel, metals, agricultural commodity market data on regular basis, daily/weekly/monthly/annually.
This is a sample report. More data could be available via subscription.
Please send your inquiry email to: service@ecprams.net
or call at +86 18606382728 
skype: oilchem-lz 
Wechat: hanamiliu
Whatsapp: +86 18606382728
website: http://www.ecprams.net